Data Analysis
Explore temporal and geographic patterns in reported battle-related fatalities across the Russia–Ukraine conflict.
Temporal Trends
Monthly aggregation of battle-related fatalities is used to examine how reported casualty levels change over time.
Geographic Patterns
Event locations are used to examine the geographic distribution of reported battle-related fatalities.
Data Visualization
Static charts and an interactive Power BI dashboard provide different views of the processed conflict data.
Interactive Dashboard
Russia–Ukraine Casualty Analysis
Explore the interactive Power BI visualization of reported battle-related fatalities and related analytical views.
Interactive Power BI report containing Israel–Palestine and Russia–Ukraine analysis. Use the report tabs to explore both pages.
Interactive Visualization
Russia–Ukraine Tableau Dashboard
Explore the interactive Tableau visualization of reported battle-related fatalities and related analytical views.
Interactive Tableau dashboard presenting Russia–Ukraine casualty trends and analytical views.
Supporting Visualization
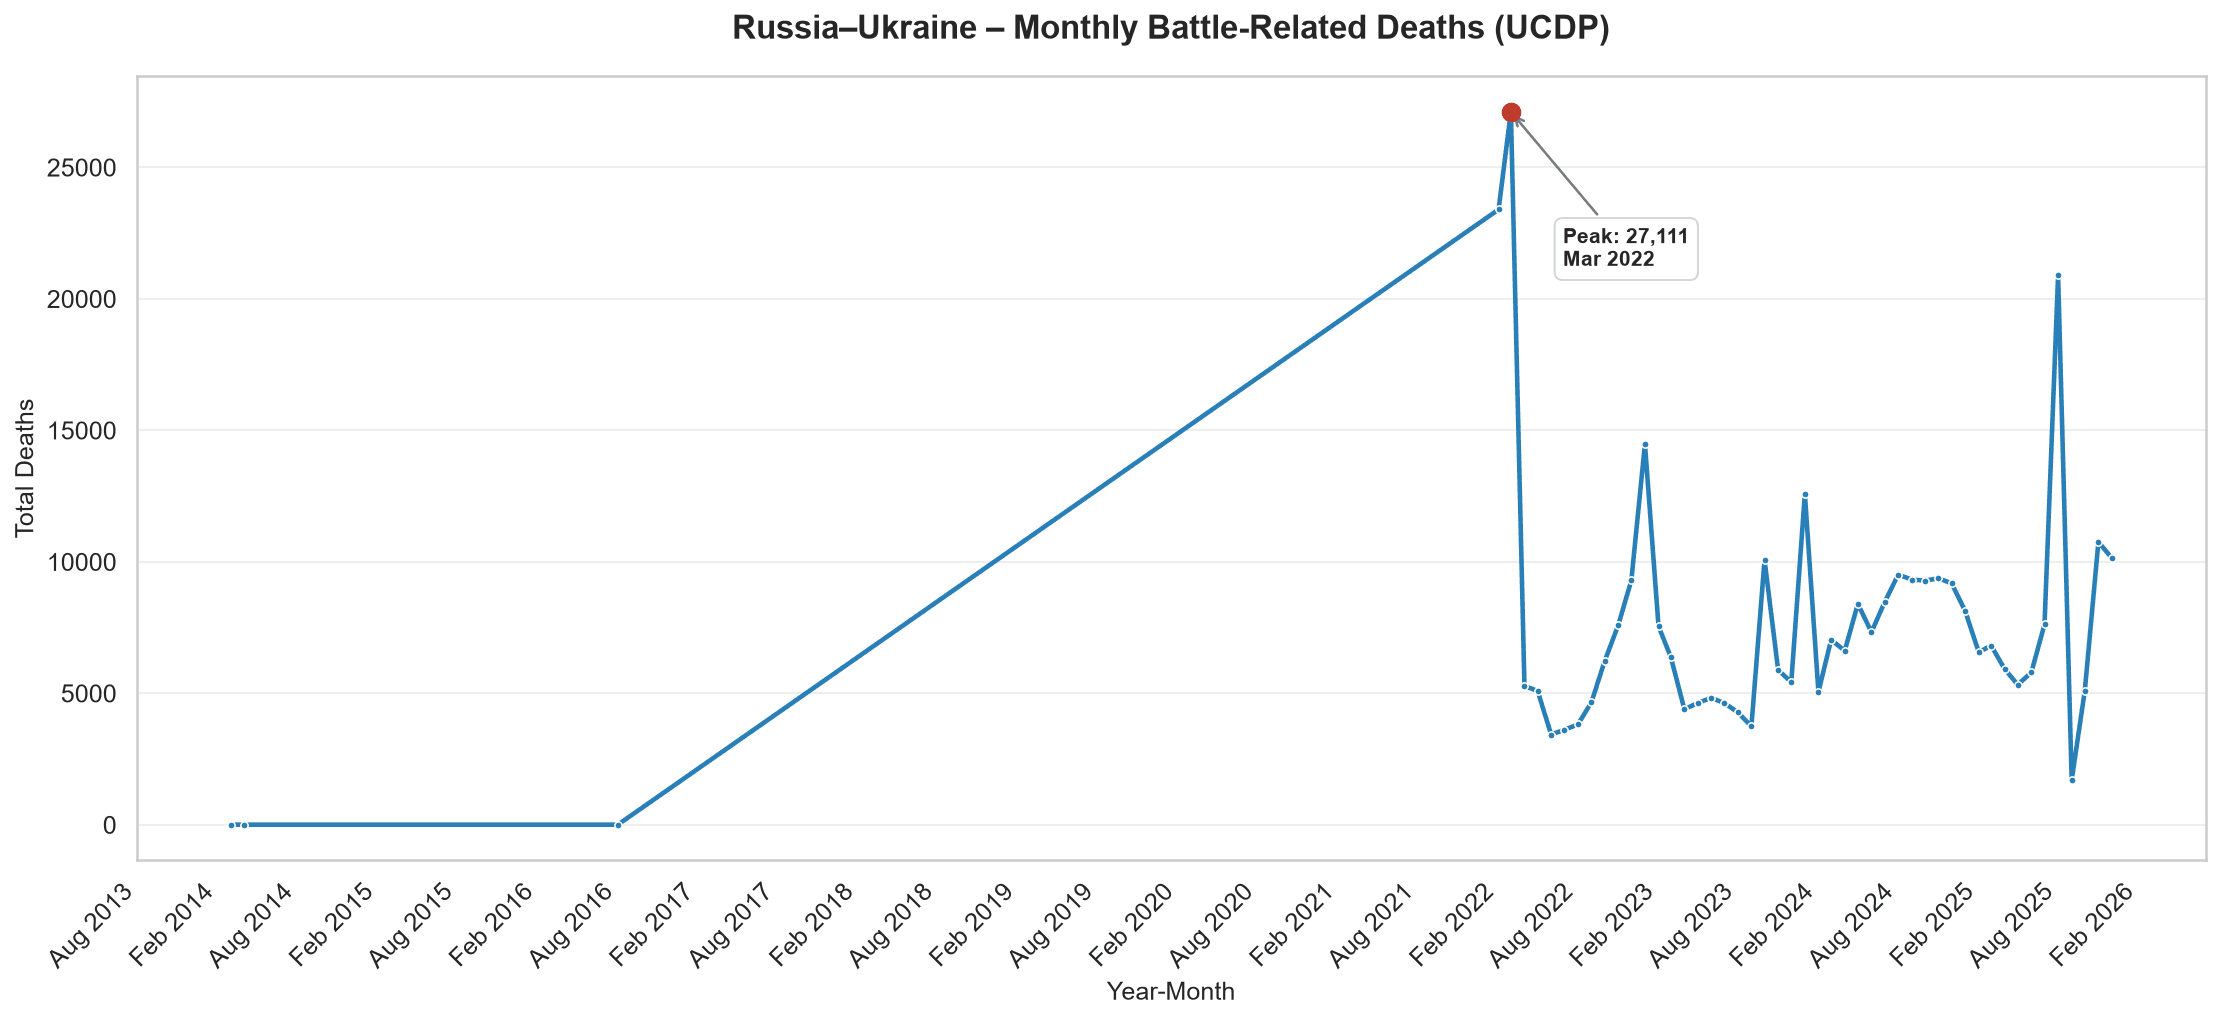
Monthly Fatality Trends
The monthly aggregation provides a compact view of changes in reported battle-related fatalities across the conflict period.
Russia–Ukraine Monthly Deaths
Monthly reported battle-related fatalities.
Methodological Context
Analytical Scope
The Russia–Ukraine analysis uses event-level conflict data filtered to Russia–Ukraine events and aggregated into monthly totals for time-series analysis.
The analysis focuses on reported battle-related fatalities, temporal patterns, and geographic distribution. It does not attempt to provide political interpretation or conclusions beyond the observed data.
Reported casualty figures may be incomplete or revised as underlying datasets are updated. Results should therefore be interpreted as analysis of the available reported data rather than a definitive count of all fatalities.