Israel-Palestine Data Analysis
Analysis of reported casualty trends, geographic differences, and demographic patterns using Gaza and West Bank casualty data.
Time Series Trends
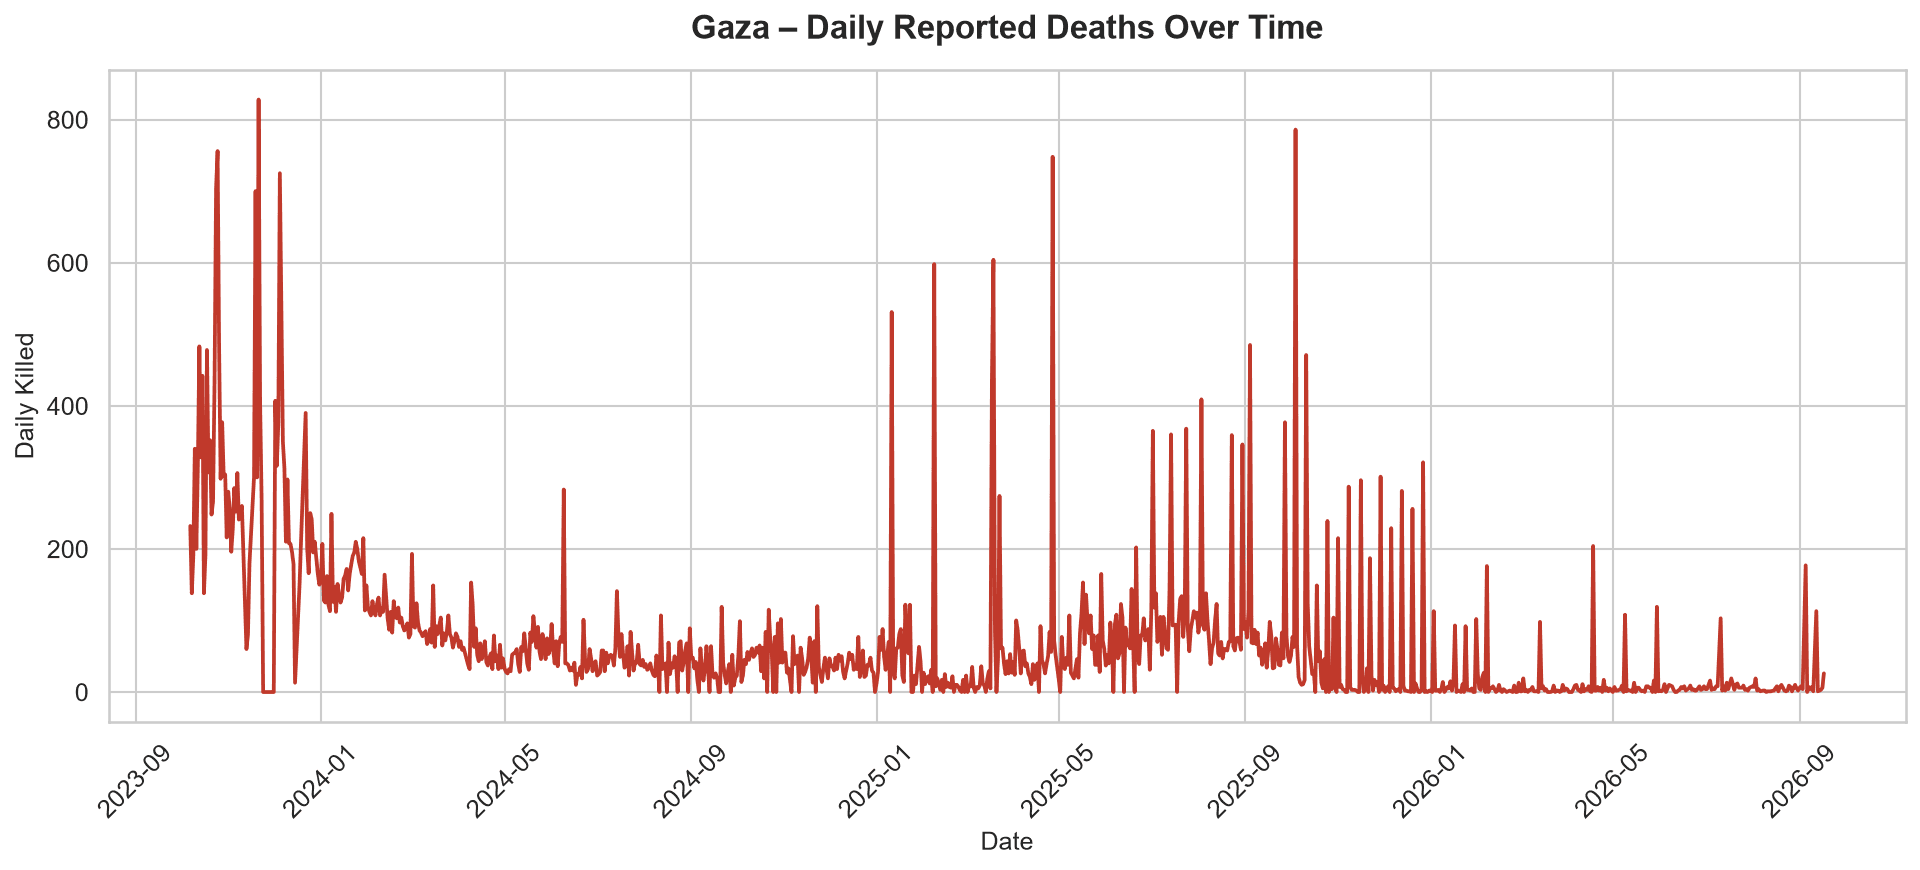
Daily reported casualty data was analyzed to examine changes over time and identify periods of higher reported fatalities.
- Gaza daily reported deaths over time
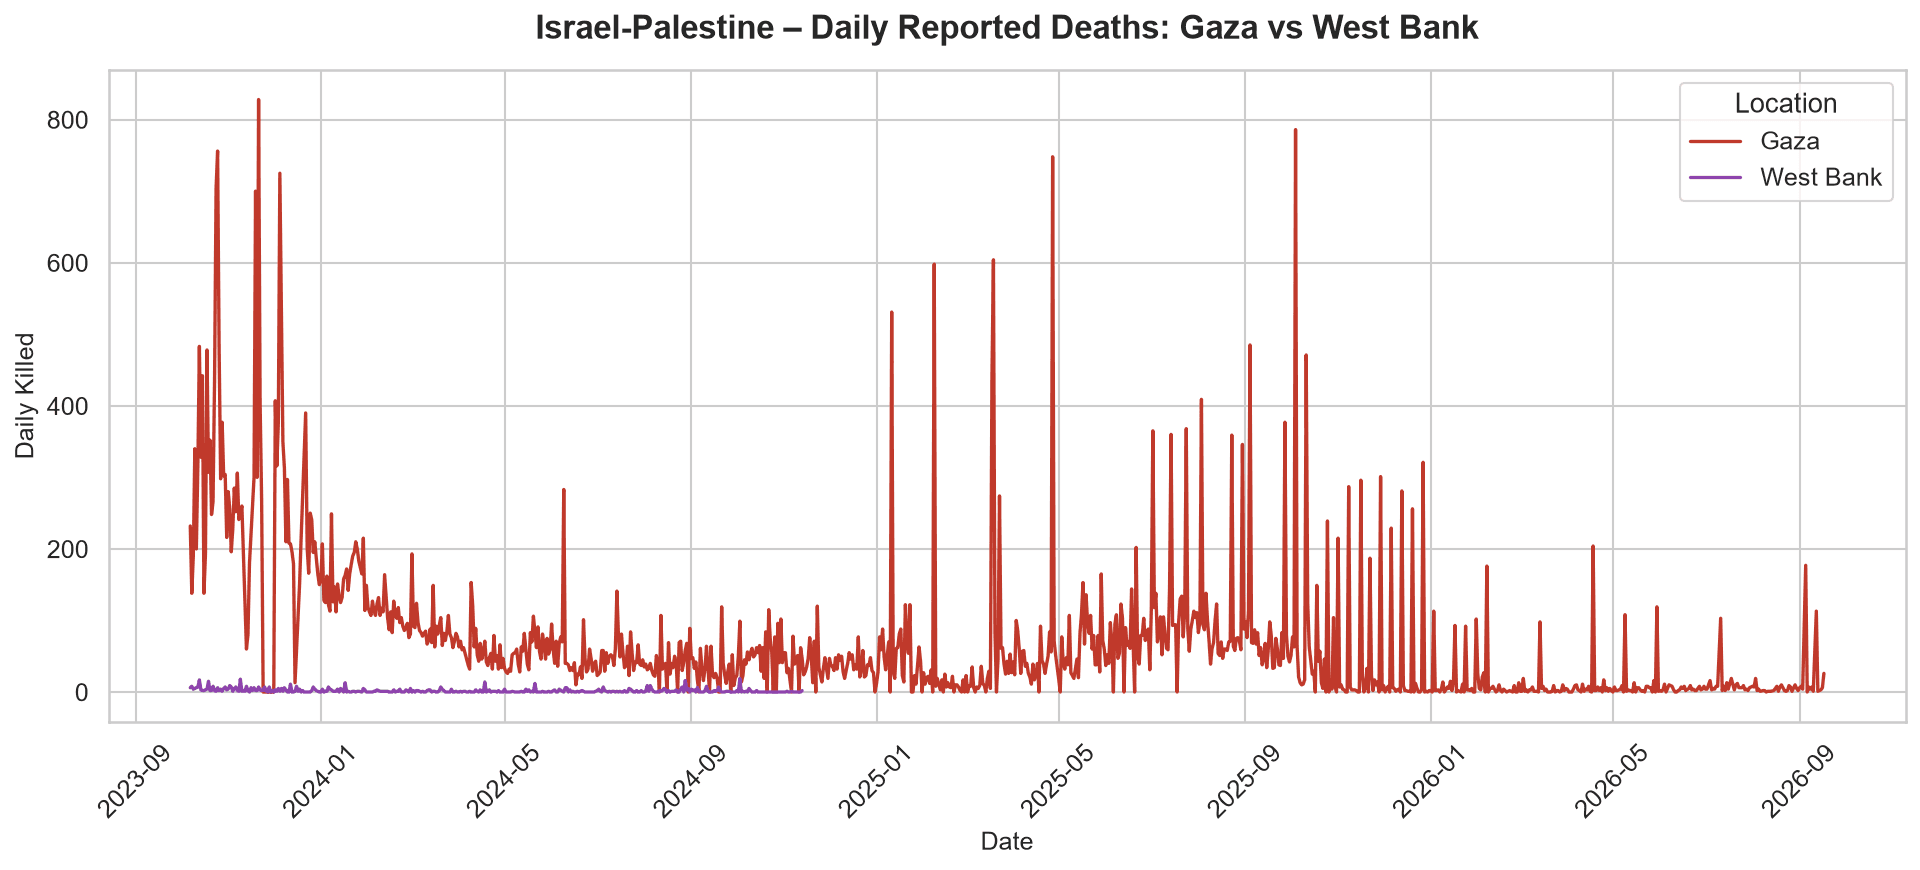
- Gaza vs West Bank comparison
- Temporal patterns in reported fatalities
Demographic Analysis
Individual-level Gaza records were examined to understand the reported age and sex distribution of fatalities.
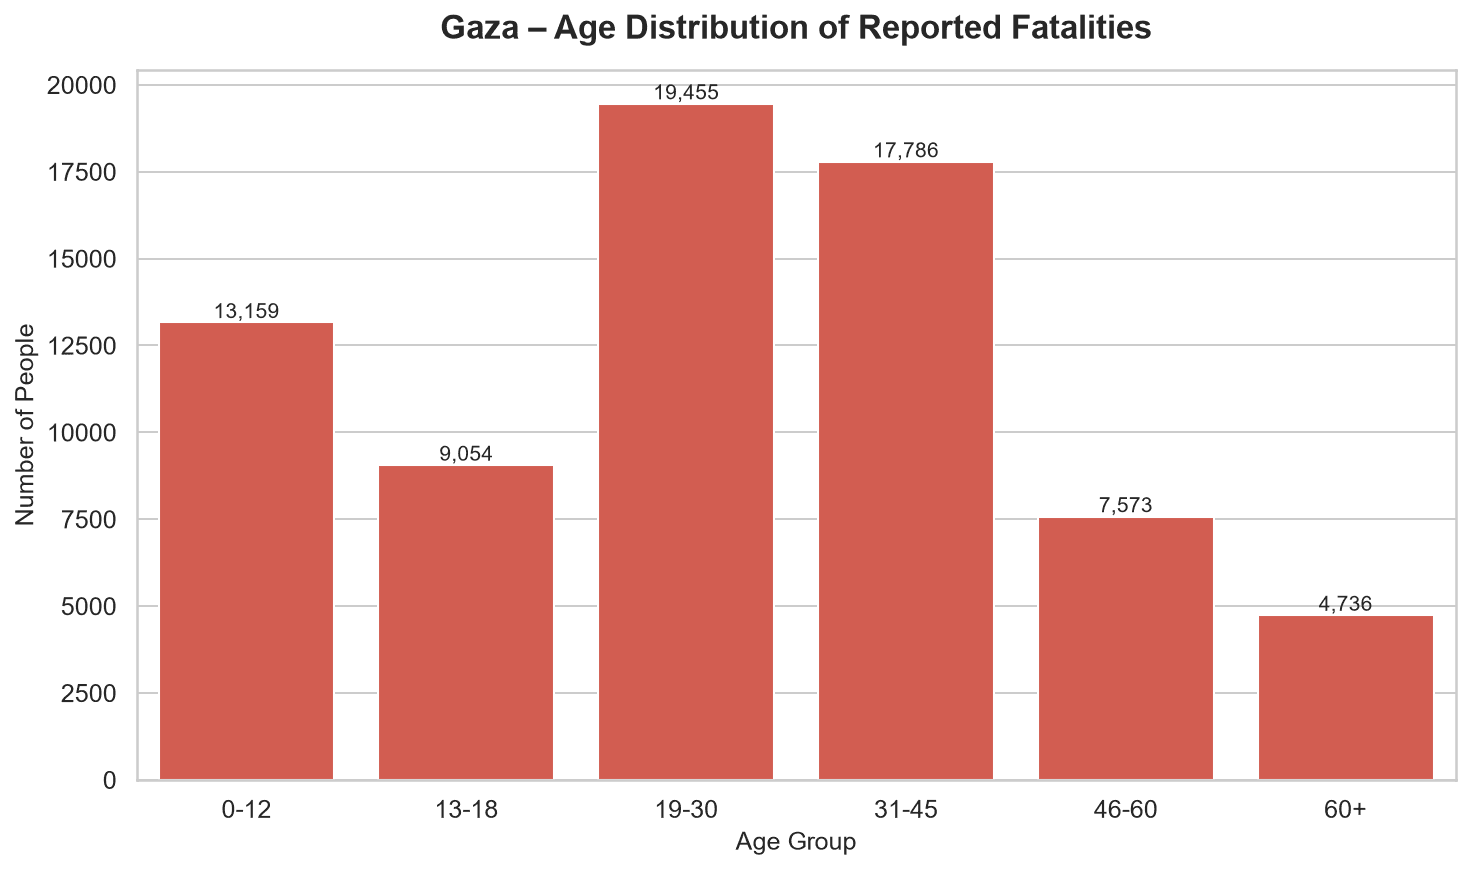
- Age distribution of reported fatalities
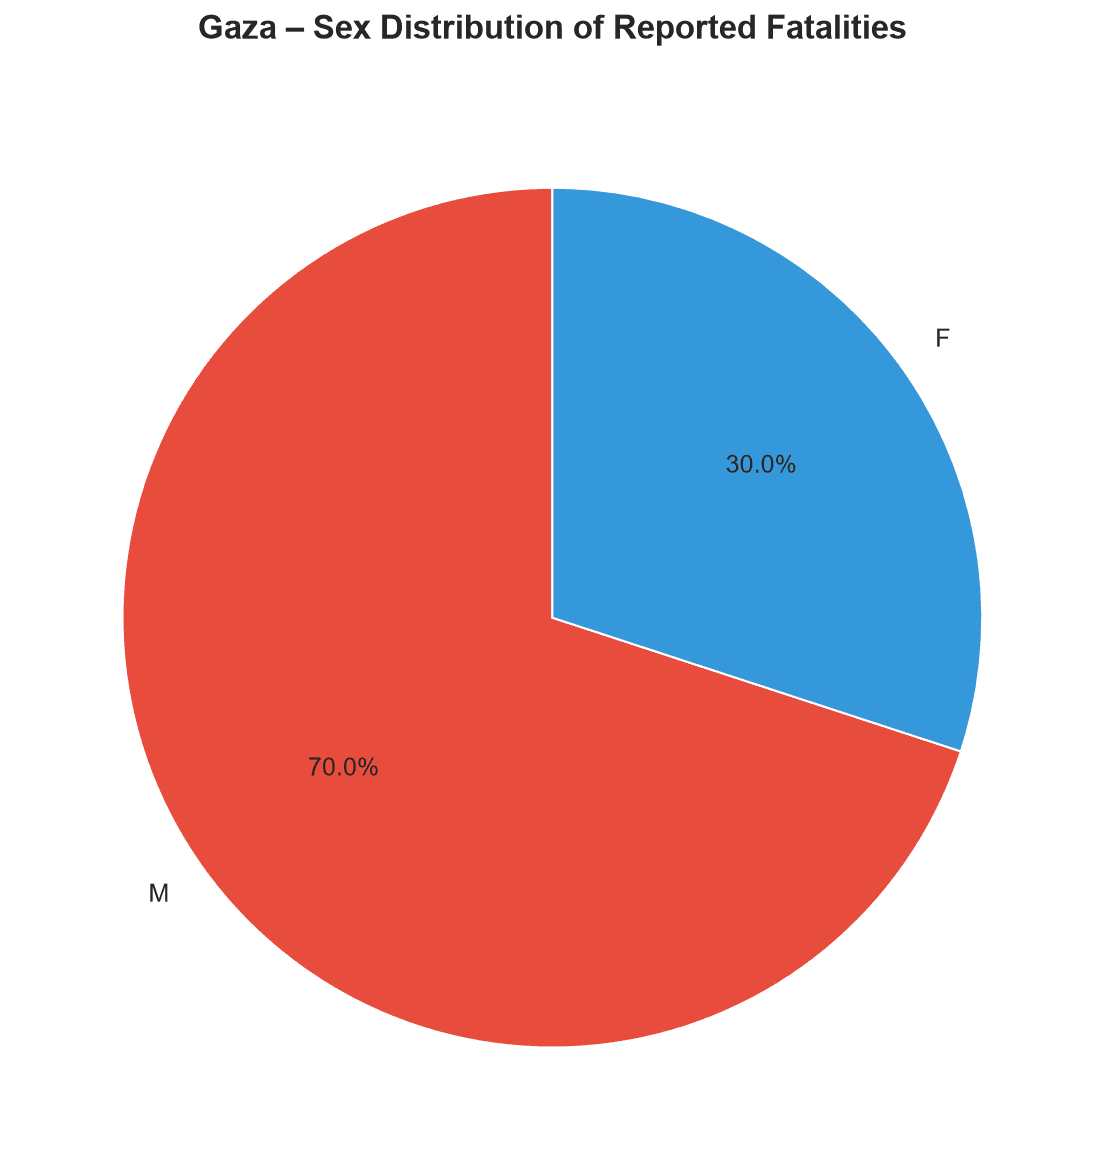
- Sex distribution of reported fatalities
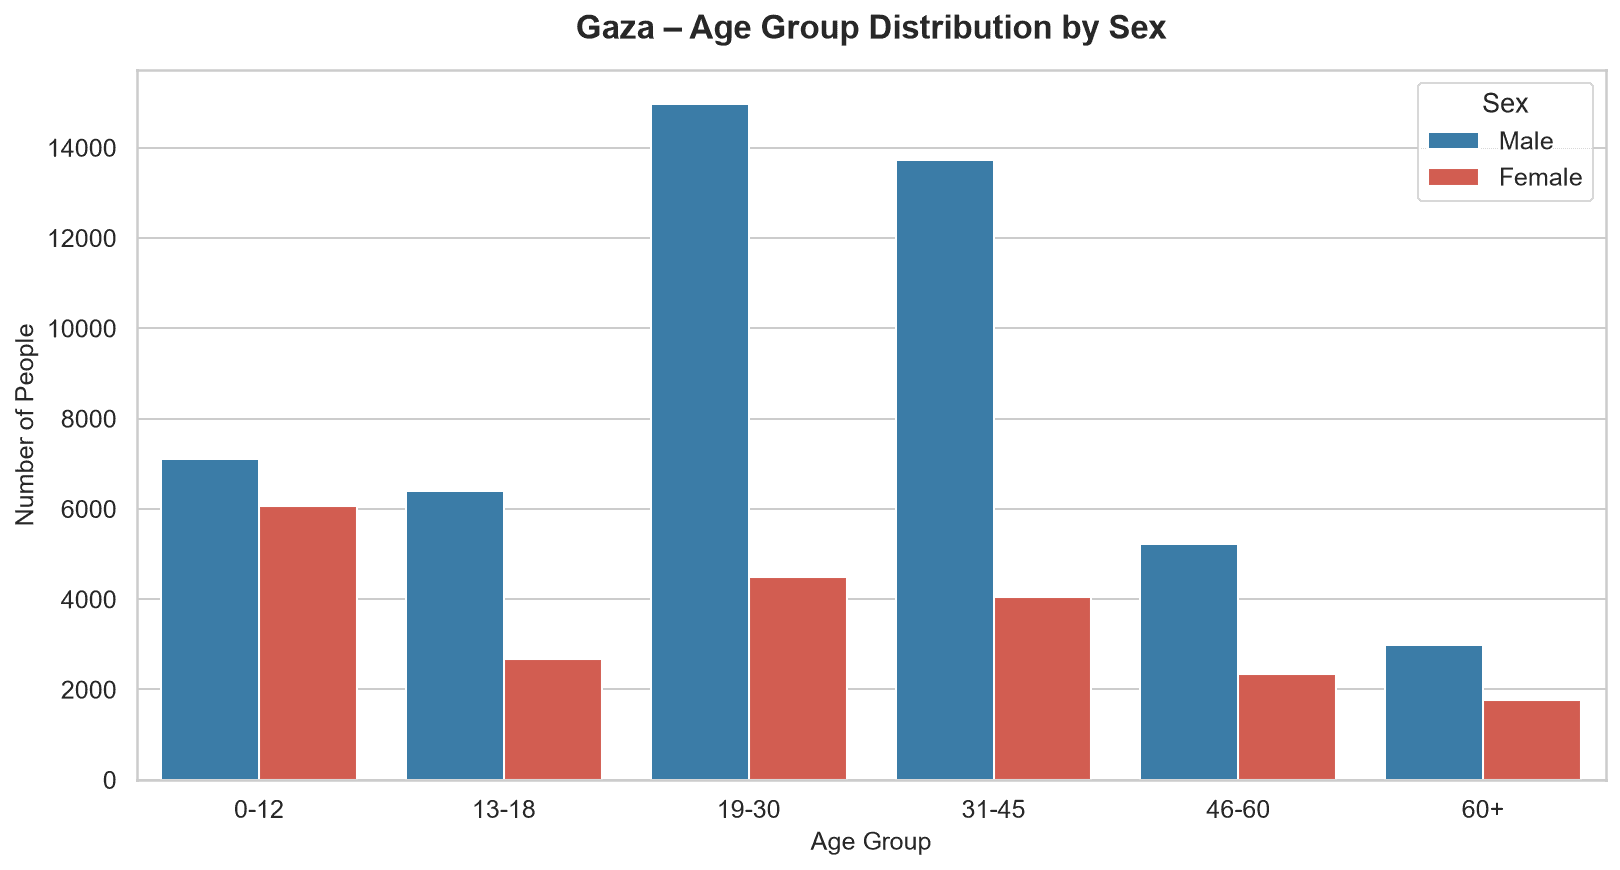
- Age group by sex
Comparative Analysis
Reported casualty totals were examined across Gaza and the West Bank to identify differences in the distribution of fatalities.
- Total reported deaths by region
- Gaza and West Bank trends
- Regional casualty concentration
Data Scope
The analysis combines daily casualty reporting with individual-level demographic records to support both aggregate and demographic analysis.
- Gaza daily casualty records
- West Bank daily casualty records
- Gaza individual demographic records
From Raw Records to Analytical Views
The analysis combines aggregate time-series data with individual-level demographic records.
01 · Aggregate
Daily Reporting
Daily Gaza and West Bank records are used to examine reported fatalities over time and compare geographic reporting patterns.
02 · Demographic
Individual Records
Individual Gaza records are grouped by age and sex to examine the demographic composition of reported fatalities.
03 · Visualization
Interactive & Static
Power BI, Tableau, and Python-generated visualizations present the resulting trends, comparisons, and demographic distributions.
Interactive Power BI Dashboard
Interactive Power BI report containing Israel–Palestine and Russia–Ukraine analysis. Use the report tabs to explore both pages.
Interactive Tableau Dashboard
Interactive Tableau dashboard presenting Israel–Palestine casualty trends and analytical views.
Supporting Visualizations
Static charts provide focused views of the underlying analysis and complement the interactive Power BI dashboard above.
Gaza – Daily Reported Deaths
Gaza vs West Bank Comparison
Age Distribution of Fatalities
Sex Distribution of Fatalities
Age Group by Sex